

Solving Systems of Linear Equations by Graphing
Mini Lecture 5.1
Learning Objectives:
1. Decide whether an ordered pair is a solution of a linear system.
2. Solve systems of linear equations by graphing.
3. Use graphing to identify systems with no solution or infinitely many
solutions.
4. Use graphs of linear systems to solve problems.
Examples:
1. Consider the system.
x + y = –3
2x + y = 1
Determine if each ordered pair is a solution of the system.
a. (4, 7) b. (4, –7)
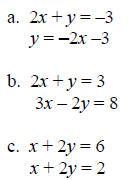
2. Solve the following systems by graphing. State the
solution (the intersection point) as an
ordered pair (x, y) or state if there is no solution, or state if there are an
infinite number of
solutions.
Teaching Notes:
• When graphing a system of linear equations, there are three possible outcomes:
1. The two lines can intersect at one point, meaning there is one solution
to the system.
2. The two lines can be parallel to one another, meaning there is no
solution to the
system.
3. The two lines are identical or coincide, meaning there are infinitely
many solutions to
the system.
• When two lines are parallel the system is inconsistent and has no solution.
• When two lines are coinciding, they are called dependent equations and have
infinitely
many solutions.
Answers:
1. a. not a solution b. yes, a solution 2. a. infinitely many solutions b. (2,
–1) c. lines parallel, no
solution
Mini Lecture 5.2
Solving Systems of Linear Equations by the Substitution Method
Learning Objectives:
1. Solve linear systems by the substitution method.
2. Use the substitution method to identify systems with no solution or
infinitely many
solutions.
3. Solve problems using the substitution method.
Examples:
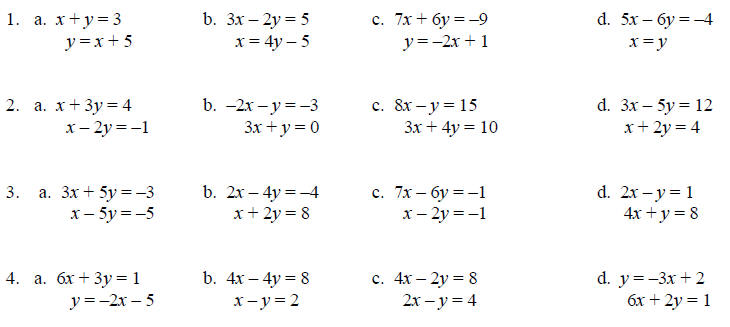
Solve each system using the substitution method. If there is no solution or an
infinite number of
solutions, so state.
Teaching Notes:
• Students like to follow specific steps so give them a list of steps to use for
solving systems
by substitution. Begin with: Isolate a variable with a coefficient of 1 first.
• Many students think they must solve for y. Stress that it does not matter
whether the variable
solved for is x or y.
• Use colored pens or markers to underline in one equation what will be
substituted in the
other equation.
• If a graphing calculator is being used in the class, graphing on the
calculator is a good way
to check solutions.
Mini Lecture 5.3
Solving Systems of Linear Equations by the Addition Method
Learning Objectives:
1. Solving linear systems by the addition method.
2. Use the addition method to identify systems with no solution or infinitely
many solutions.
3. Determine the most efficient method for solving a linear system.
Examples:
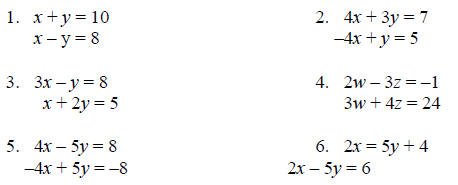
Solve the following systems by the addition method.
Teaching Notes:
• When solving a system of linear equations there are three methods:
Graphing (5.1)
Substitution (5.2)
Addition (5.3)
• Any of the three methods will work when solving a system and produce the
correct
answer.
• Teach students how to determine which of the three methods is the most
efficient when
solving a system of equations.
Answers: 1. (9, 1) 2.(-1/2, 3) 3. (3, 1) 4. (4, 3) 5.
infinitely many solutions 6. no
solution
Mini Lecture 5.4
Problem Solving Using Systems of Equations
Learning Objectives:
1. Solve problems using linear systems.
Examples:
Use variables to represent unknown quantities. Write a: Let x = and y =
statement for each problem.
(Do not solve).
1. The sum of two numbers is 14. One number is six times larger than the other.
Find the two
numbers.
2. Three pairs of socks and two pairs of mitten cost $42. One pair of the same
kind of socks
and four pair of the mittens cost $24. Find out how much one pair of socks and
one pair of
mittens cost.
3. John has $5 bills and $10 bills in his wallet. He has a total of $80. He has
twice as many $5
bills as $10 bills. How many $5 bills and how many $10 bills does he have?
Now, for problems 4 – 6, write a system of equations that
models the conditions of each problem.
(Do not solve).
4.
5.
6.
Solve each of the following using a system of equations.
7. The sum of two numbers is 11. The second number is 1 less than twice the
first number.
Find the two numbers.
8. Alexis has $1.65 in nickels and quarters. She has 9 coins altogether. How
many coins of
each kind does she have?
9. Paul invested $12,000 in two accounts. One account paid 4% interest and one
account paid
5% interest. At the end of the year his money had earned $560 in interest. How
much did he
invest in each account?
10. A department store receives 2 shipments of bud vases and picture frames. The
first shipment
of 5 bud vases and 4 picture frames costs $62. The second shipment of 10 bud
vases and 3
picture frames cost $84. Find the cost of a vase and a picture frame.
Teaching Notes:
• Stress the importance of reading the problem several times before beginning.
Reading aloud
really helps.
• Have students write a Let x= and y = statements for each word problem before
trying to
write the system of equations.
• Help students look at the system they have created and determine which method
of solving
will work best.
• Remind students to make sure their answers make sense for the given situation.
• Try to build confidence with word problems.
Answers: 1. Let x = one number; let y = the other number.
2. Let x = cost of 1 pair of socks; let y = cost of
1 pair of mittens. 3. Let x = number of $5 bills; let y = number of $10 bills

7. The numbers are 4 and 7 8. 3 nickels, 6 quarters 9.
$4000 invested @ 4% and $8000 invested @ 5%
10. bud vases $6, picture frames $8
Mini Lecture 5.5
Systems of Linear Inequalities
Learning Objectives:
1. Use mathematical models involving systems of linear inequalities.
2. Graph the solution sets of systems of linear inequalities.
Examples:
1. Graph the solution set of each system.
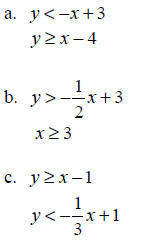
2. Name one point that is a solution for each system of
linear inequalities in examples
1a, 1b, and 1c.
a.
b.
c.
Teaching Notes:
• When the inequality symbol is > or <, the line should be dashed (- - - - -).
• When the inequality symbol is ≥ or ≤, the line should be solid ( _______).
• When graphing inequalities, it is easy to see the overlap of the graphs if
different colored
pencils are used to graph each inequality.
Answers:
2. a. Answers will vary b. Answers will vary c. Answers will vary