Graphing Linear Inequalities
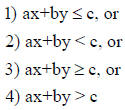
A linear inequality in two variables has the
following possible
forms:

Where a, b, c ∈R and (a, b) ≠ (0,0)
Ex.
Graph the inequality:
x + 3y ≥ 6 .
Note: The points on the line x+3y=6 will be a part of the solution
set of the above inequality.
Step 1: Find the x and y intercepts of x+3y=6. ( Two
points
determine a line).
Step 2: Since the inequality is of the form ≥ , we will draw a solid
line passing through the intercepts, otherwise we will draw a
dashed line.
Step 3: The points lying on the line in step 2 are part of the
solution set but there are others as well. In fact, the line separates
the plane in two half-planes: The upper plane and lower planes.
The plane containing the points satisfying the inequality will give
the solution to the inequality.
To find the solution: We choose a point (We will call this the
test point) not on the boundary and evaluate the inequality at
those values. If the statement is True, then the solution set is
that region. If the statement is False, the solution set is the
other region.
Step 4: Shade the appropriate region.
Note: The point (0,0) is a good test point to use as long as it is not
on the boundary.
Another way to identify the region satisfying the inequality is to
solve the inequality for y. Remember the various rules for
inequalities.
a) When multiplying or dividing through an inequality
by a negative number, we must change the direction
of the inequality.
b) When taking reciprocals on both sides, we must
change the direction of the inequality.


